Applications
Display Builder
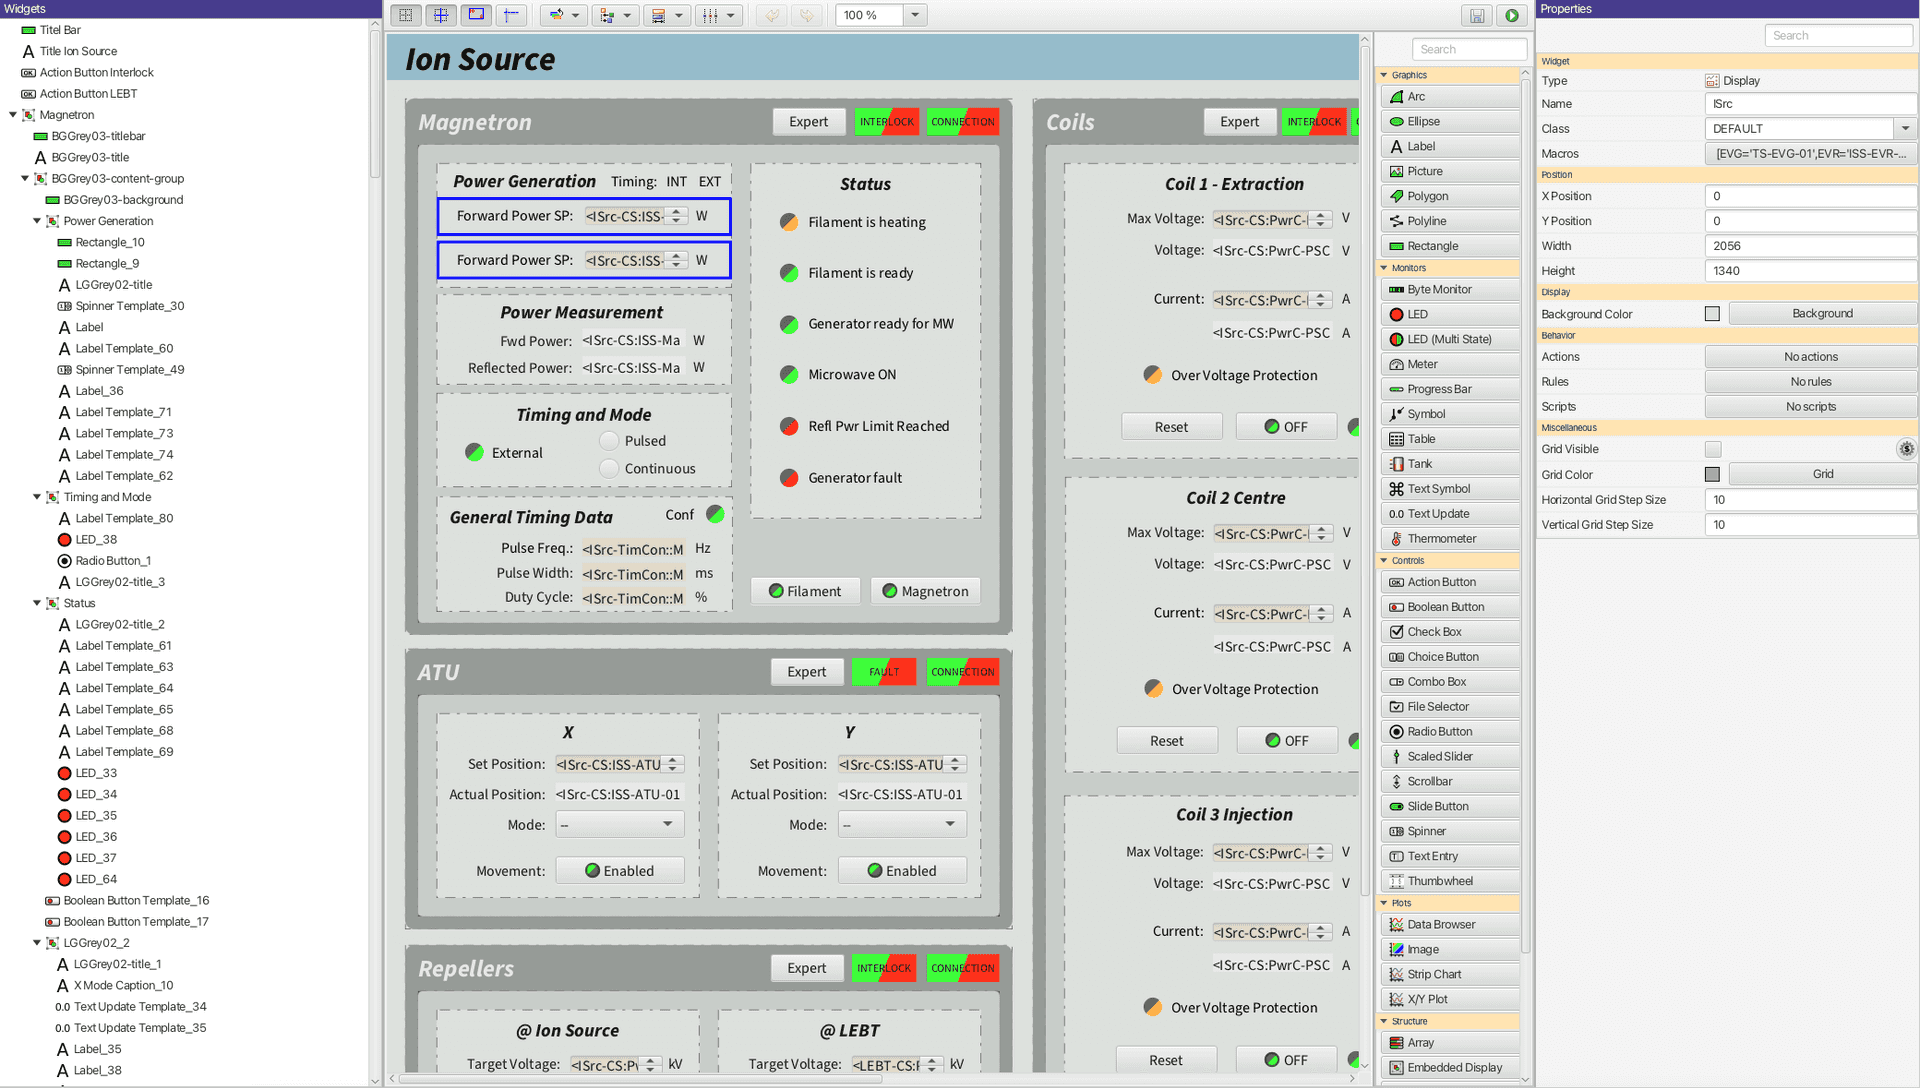
Display Builder is an operator interface panel builder for CS-Studio Phoebus. Driven by changes in computer graphics technology and trends, EPICS operator interface tools tend to undergo fundamental transformations every 10 years, recently accelerating. The Display Builder aims to minimize these transitions. It is in large part backwards compatible with the original CS-Studio BOY tool and there are converter tools for EDM and MEDM displays.
Key features include:
- Heavy use of threading. Display files are loaded in background threads, related displays are loaded in parallel, plot images are prepared in separate threads, scripts are executed off the user interface thread.
- Large number of single-purpose widgets. For example, an
Ellipsefor static graphics, anLEDthat changes between on/off states based on a PV, and aMulti State LEDthat changes between more than two PV states. Widgets with specific purposes are more obvious not only to the end user but also to tools which translate between display file formats. - The PV layer supports EPICS Channel Access, PV Access, local PVs, simulated PVs, but also other protocols like MQTT. The data flow is controlled using the Reactive Extensions for Java.
- Model, Representation, Runtime and Editor are strictly separate modules, allowing each to evolve separately.
- The Representation is based on JavaFX, the most modern Java GUI library, but as mentioned the representation is fundamentally separate from the model and runtime. In principle, we could replace the graphics library, and a proof-of-concept had indeed been implemented based on SWT.
The Display Builder file format is saved with the .bob extension and is "compact XML" similar to this:
<widget type="label">
  <x>100</x>
  <y>200</y>
  <text>Hello</text>
<widget>
Such an XML format can be read and written by many tools, simplifying the programmatic generation of displays. The minimal nature without any direct references to the display builder will simplify future moves to the next greatest EPICS display tool.
A purely web based tool called Display Builder Web Runtime (DBWR) utilizes the same XML format and is available for viewing Display Builder files in a web browser. This allows CS-Studio Phoebus screens to be viewed within the application and on a web browser without any changes to the underlying .bob file.
Alarm Table
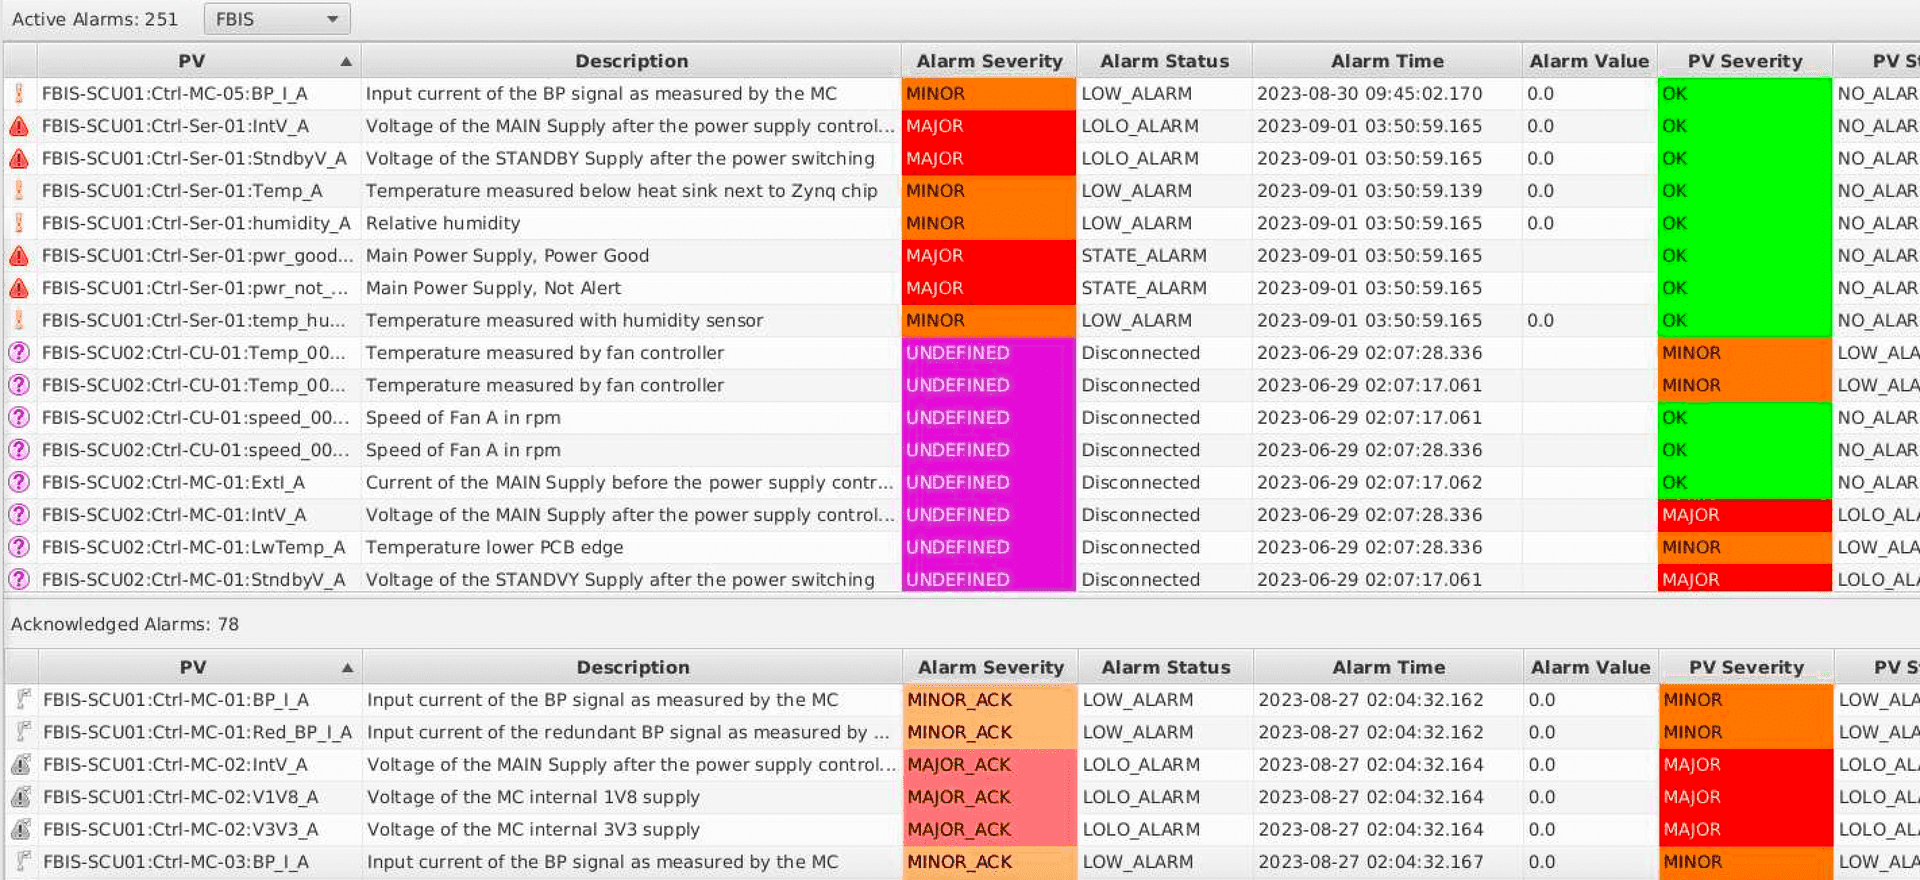
The Alarm Table application displays the current state of alarms in the control system. Its interface will show all current alarms and give operators helpful information on what each alarm means and the steps needed to address the issue. Alarms can be acknowledged, which moves them to a separate table of acknowledged alarms.
Alarm Log
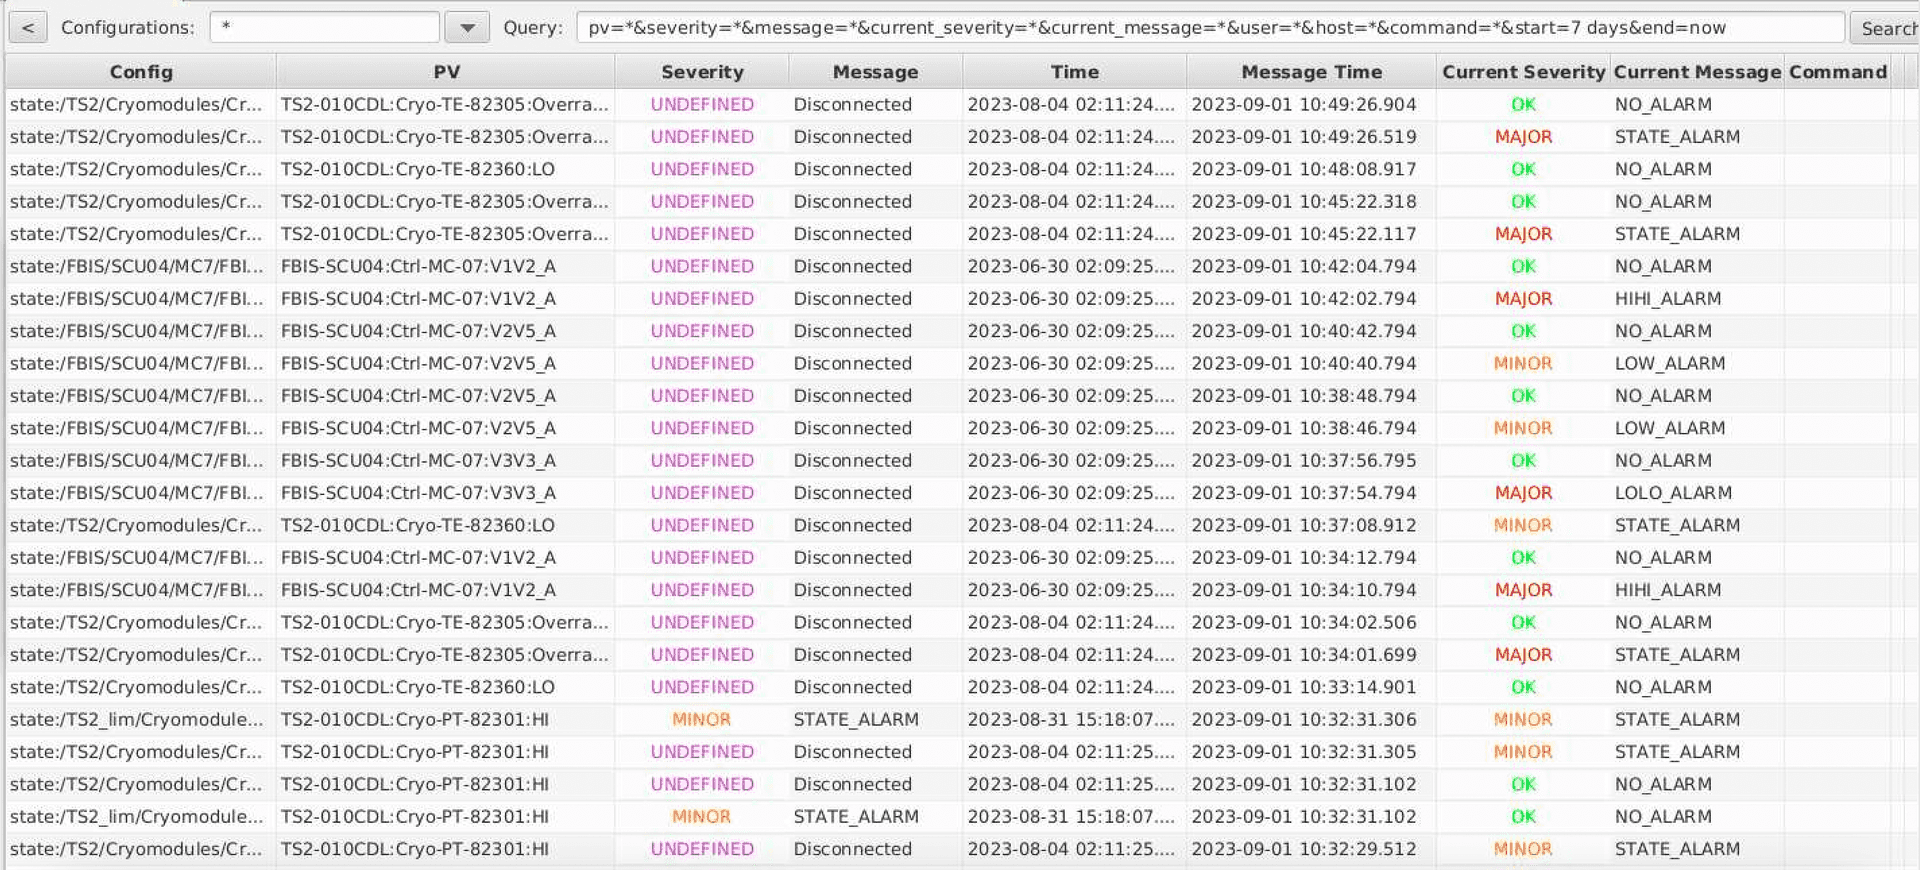
In order for the alarm system to be effective and functional, proper configuration and periodic tuning is essential. While the Alarm Table displays the current state of the control system alarms, the Alarm Log Table gives users a view of past alarm events. The user interface allows users to effectively search, filter, and parse through the archived alarm messages which can help to better understand past events and better configure the Alarm Server for the future.
Channel Table
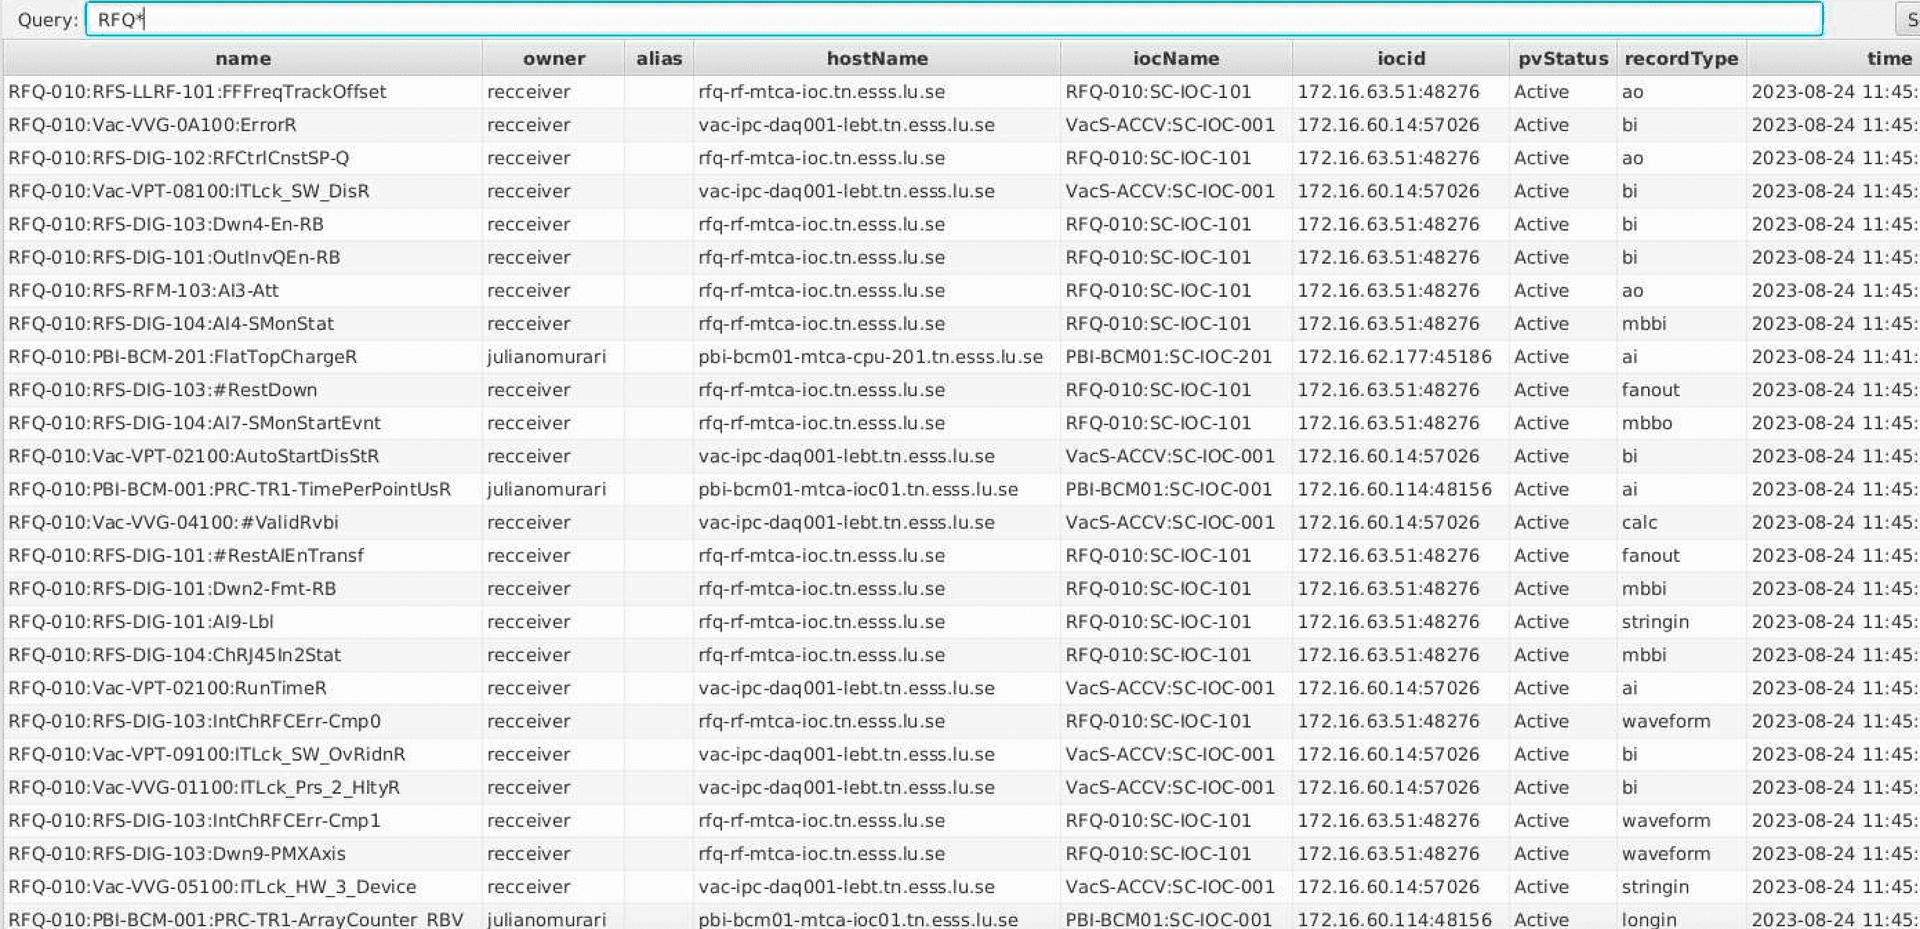
The Channel Table application features a search box that queries the control system directory service for a list of channels that match certain conditions, such as physical functionality or location. Queries will result in a list of PVs that match the filter along with various PV metadata including the IOC Name, Host Name, Record Type, Description, and PV Status. Channel Table also provides mechanisms to create new metadata, allowing for different perspectives of the same set of channel names.
Data Browser
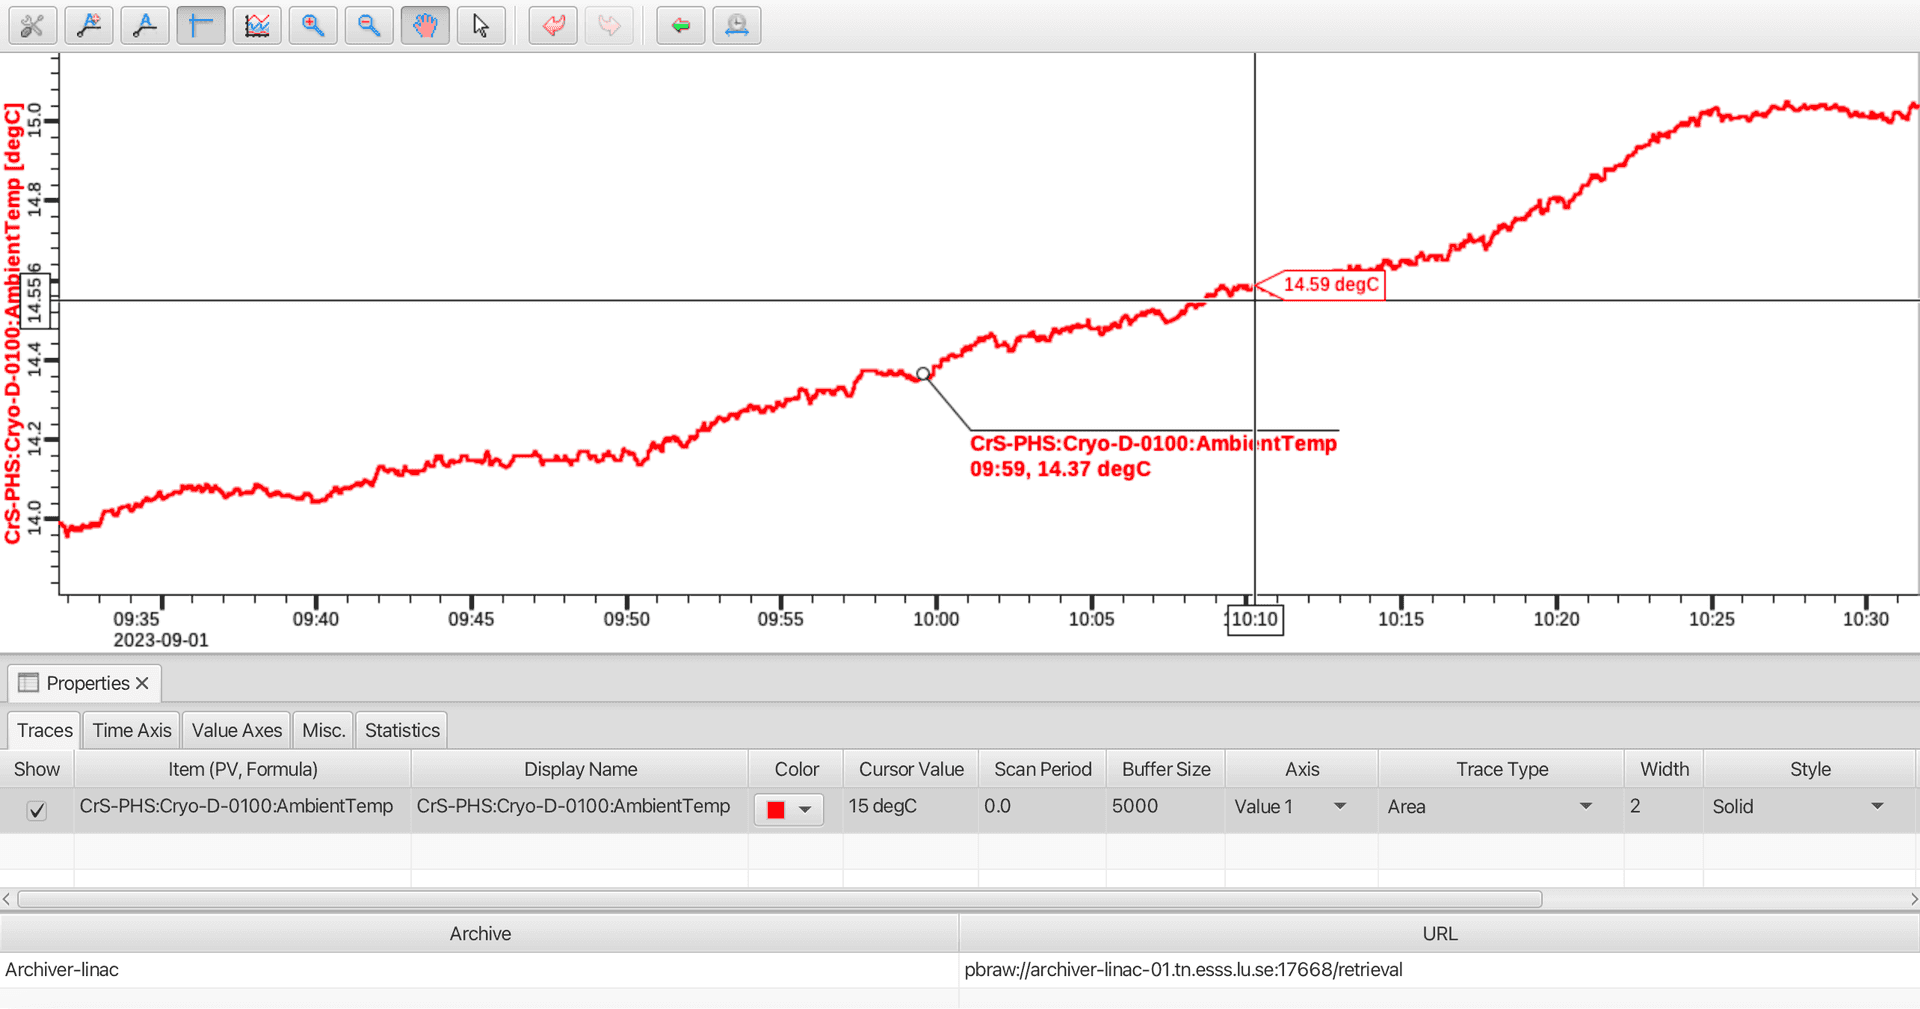
The Data Browser is a trending tool for displaying both live and archived control system data in a Strip-Chart type plot. Data Browser plots are saved as .plt files and contain the configuration of the specific plot so they can be easily reopened later and integrated with Display Builder displays.
The current data on the plot can also be easily captured in a snapshot image or exported directly into spreadsheet or Matlab formats. Users can annotate the plots to highlight important events and the snapshot images can be quickly attached to Logbook entries, emailed to other users, or saved locally.
Log Entry Table / Send to Logbook
CS-Studio Phoebus contains a pluggable framework which allows applications to create and view log entries to several different implementations of Logbook services including Olog, Olog-ES, ELOG, and SNS operations logbook.
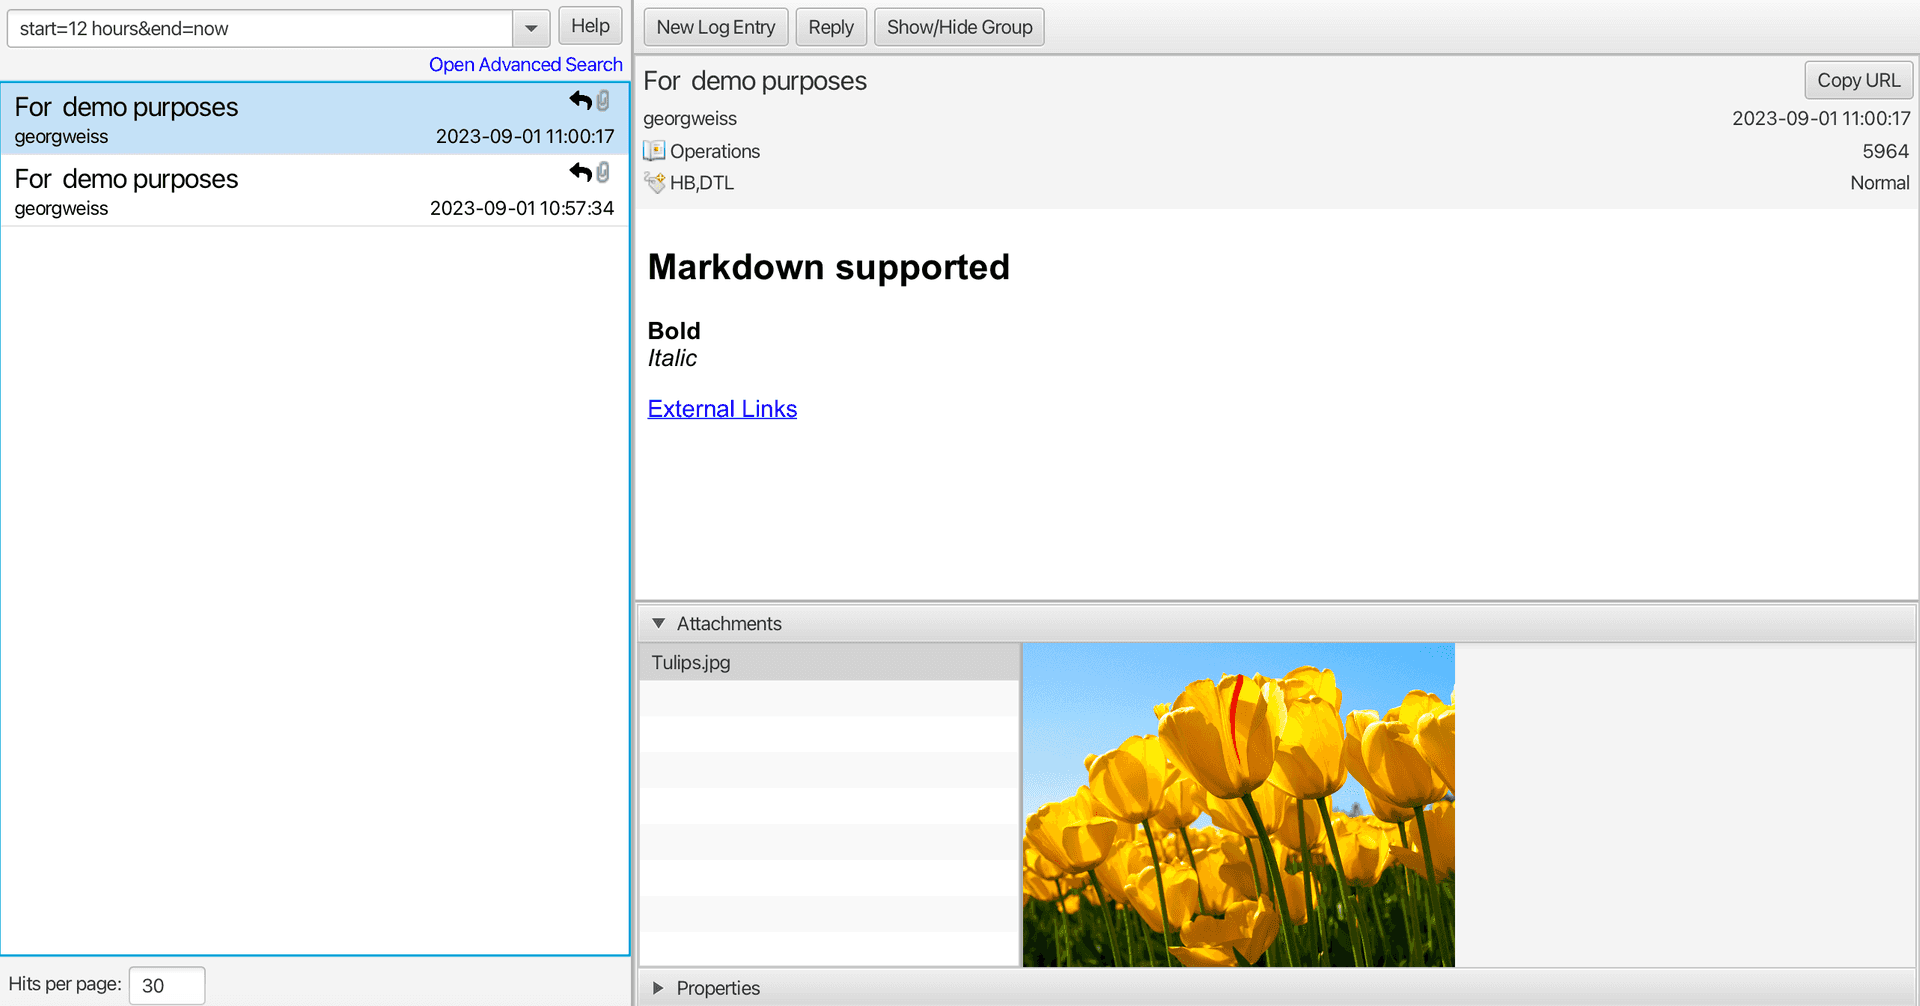
The Log Entry Table displays log entries and any attached files that might be included while also letting users search for specific log entries that match their filtered query. Many other applications integrate with the Logbook by including a “Send to Logbook” button which allows for the quick creation of an entry. The log entry menu also easily lets users attach images of the current CS-Studio window or Data Browser snapshot.
Probe
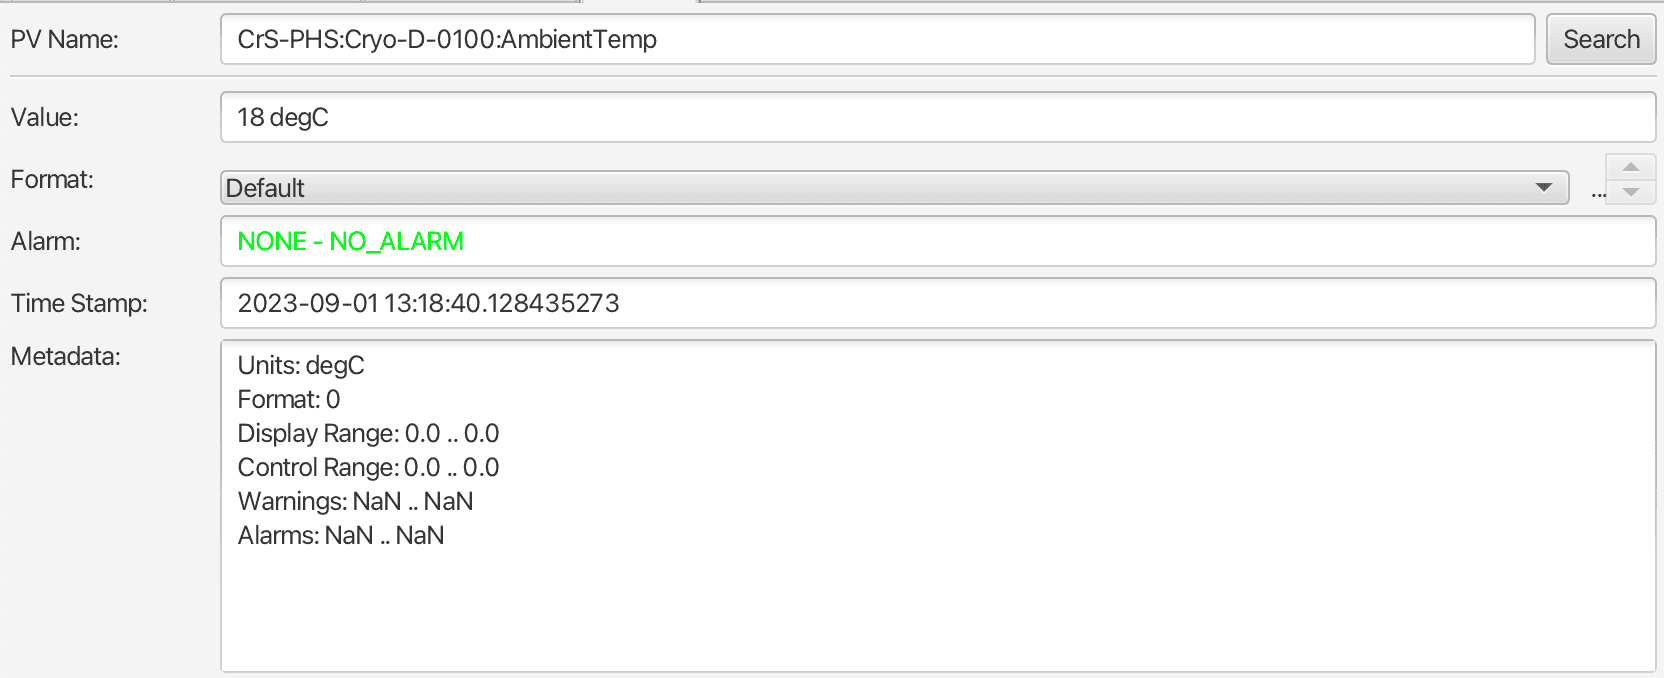
The Probe tool allows users to quickly view the current value and status of a control system signal. The current alarm state, last update timestamp, and any PV meta-data are shown. Users can also use Probe to update the value of the PV by clicking into the Value box and typing the new value.
Save And Restore
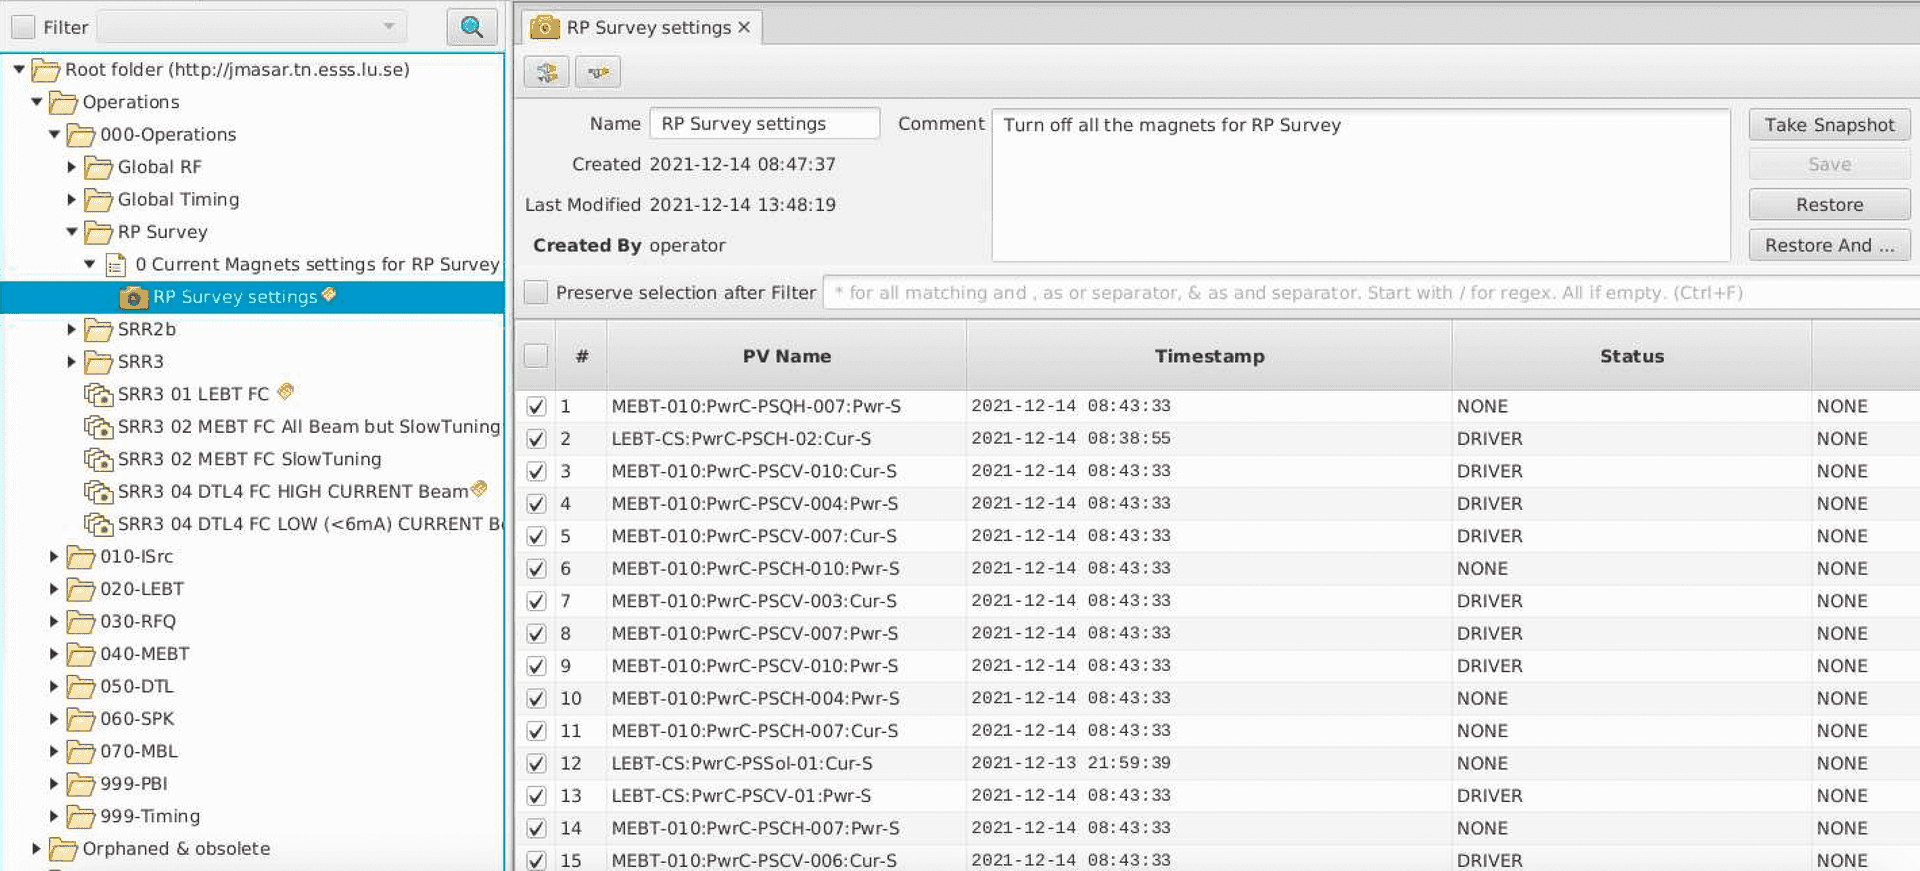
The save & restore application is used to take a “snapshot” of a user-defined list of PV values. Typical use case is to save the configuration of a subsystem when it has been tuned to a wanted state. Snapshot data can be used to restore the PV values in order to put the subsystem back to the same state. In the client application users may modify values or exclude PVs prior to restore.
Snapshots may also be combined to let a restore operation process a larger set of PVs.
Scan Editor / Scan Monitor
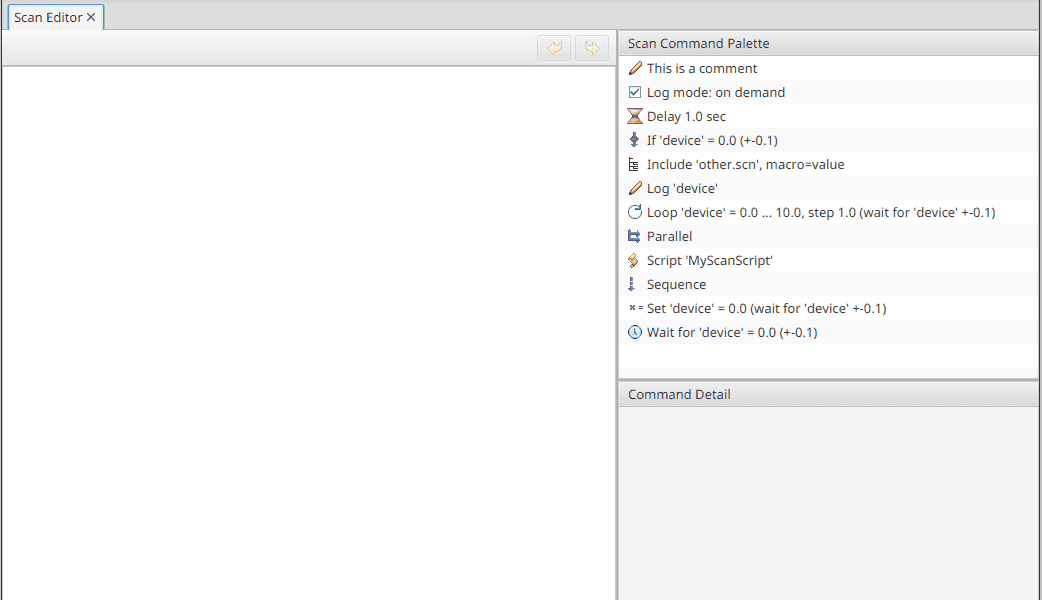
The Scan Editor application is the interface for creating the logic for a specific scan. It gives a drag and drop interface for adding commands such as conditional branches, wait calls, step loops, and calling scripts. Once the logic is completed and submitted, the scan is run on a central server.
The Scan Monitor tool shows which scans are running and a history of completed scans.
